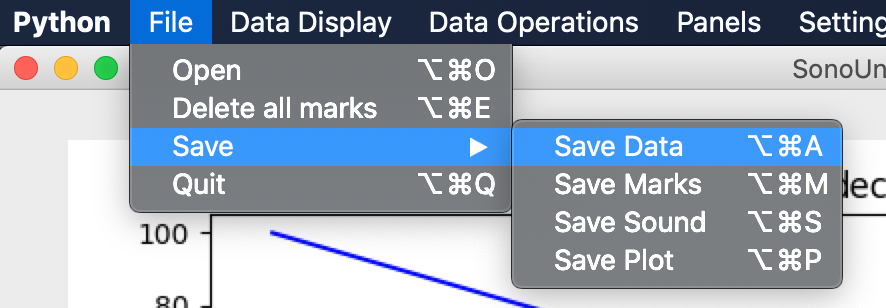
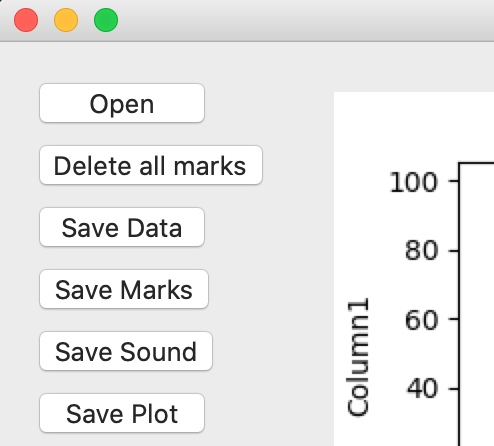
There are two ways to save files: one is in the file menu, the save sub-menu; and the other is with the button placed on the file panel (Image 10), which one have to be shown with the File item in the Panels menu (Image 9). Both methods have the same results.
The software allows to save the data plotted on a csv file, to do that you have to use the ‘Save data’ item on the menu ‘File’, sub-menu ‘Save’ (Image 14). Another option is the button ‘Save data’ on the file panel (Image 10, see below).
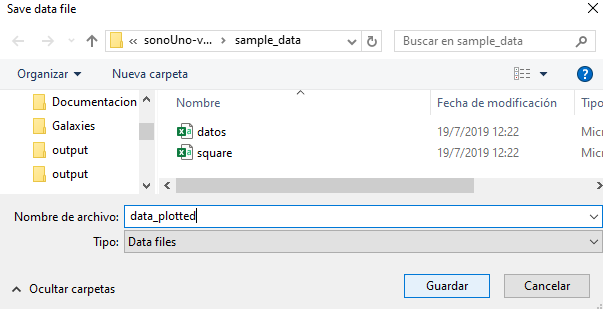
The save data option shows a pop-up window of the file system (Image 15) that allow the user to select the directory and the name of the csv file.
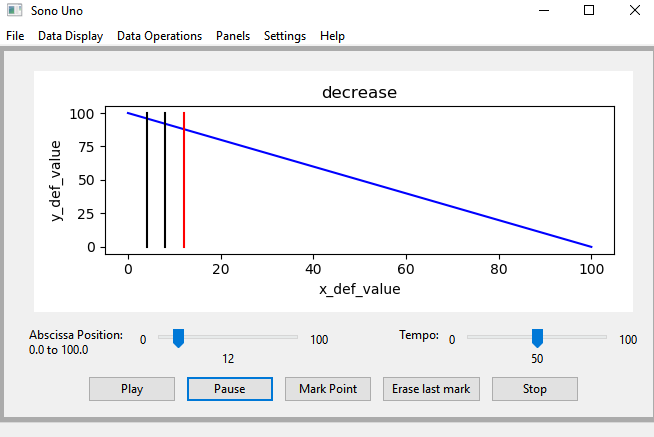
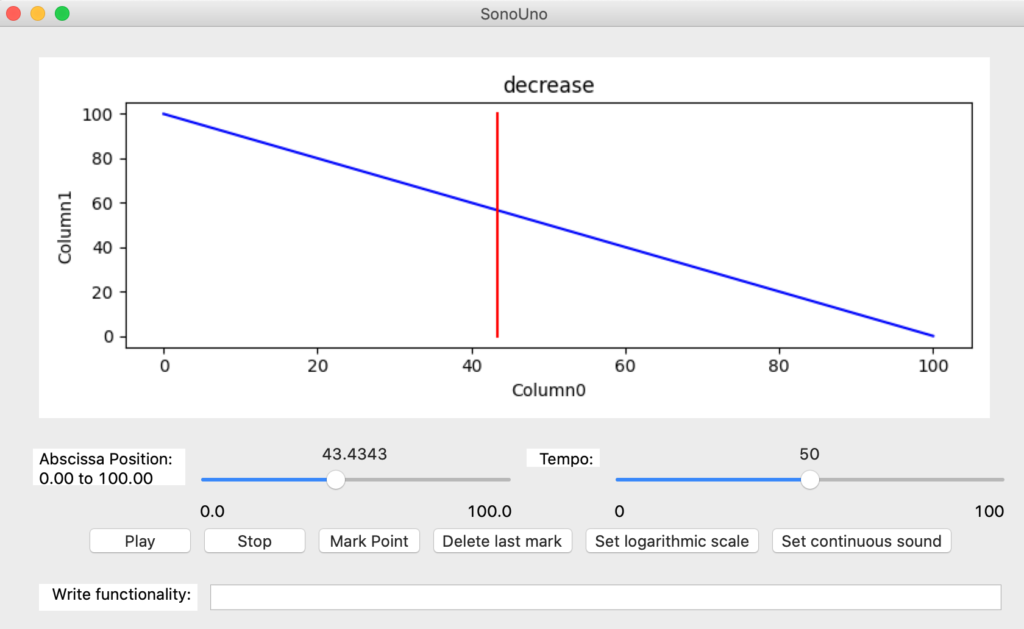
Before continuing with the save methods, remember that the software allows to do marks of interest on the data, saving the coordinates inside an array (Image 16), this topic is explained in the corresponding section. We mention it here because in the next lines is described the save marks method.
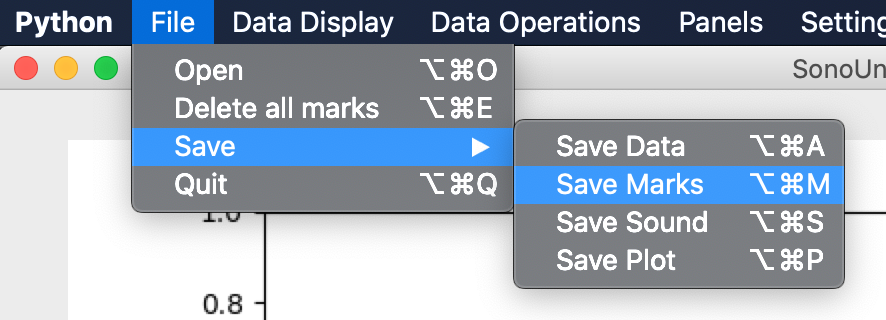
To save the values of the marks performed on the data array the user have to press the save marks item, placed on the save sub-menu on the file menu (Image 17), or press the save marks button on the file panel on the left of the window (Image 10, see before) (to enable the panel press the file item on the panels menu).
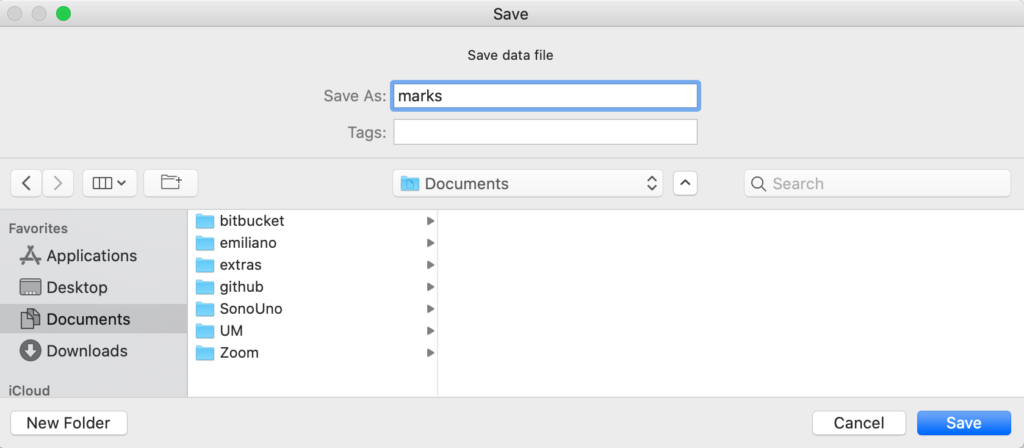
The save marks option shows a pop-up window of the file system (Image 18) that allows the user to select the directory and the name of the text file. After saving them, the marks are deleted from the sonoUno and the plot (Image 19).
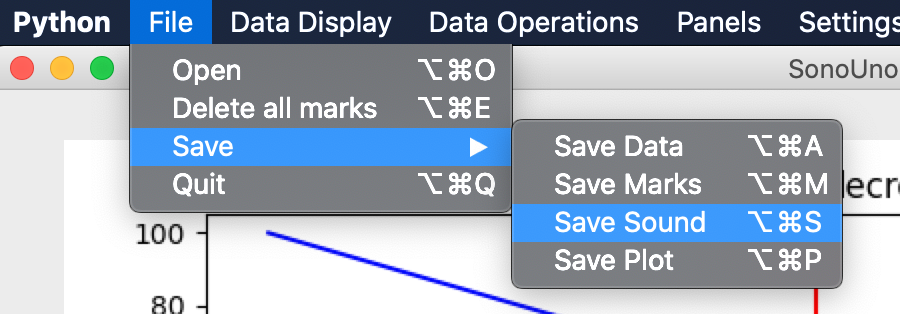
-Another save option is the sound of the data. The software will save the sound corresponding to the actual data plot but with some standard sound configuration. In order to save the sound, the user have to press the save sound item on the save submenu of the file menu (Image 20), or the button save sound on the file panel on the left of the window (Image 10) (to enable the panel press the file item on the panels menu).
Like the others save option, the save sound element shows a pop-up window of the file system, where the user can choose the directory and the name of the file to save.
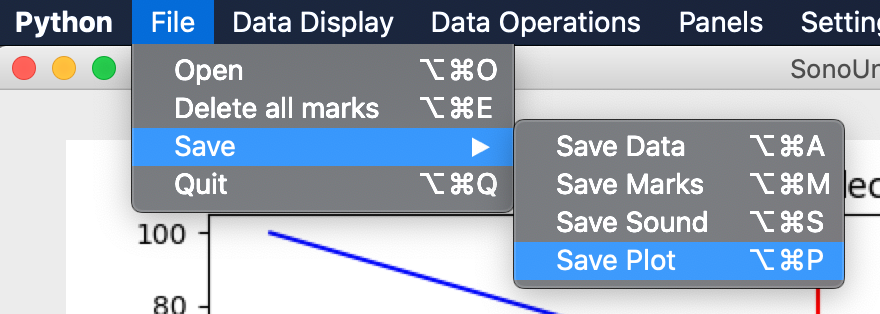
Finally, the user can save the plot with the save plot item on the save sub-menu of the file menu (Image 21), or the button save plot on the file panel on the left of the window (Image 10) (to enable the panel press the file item on the panels menu).
The save plot element shows a pop-up window like the others, which allow to set the directory and the name of the file to save. To save the file press save on the pop-up window or the enter key.
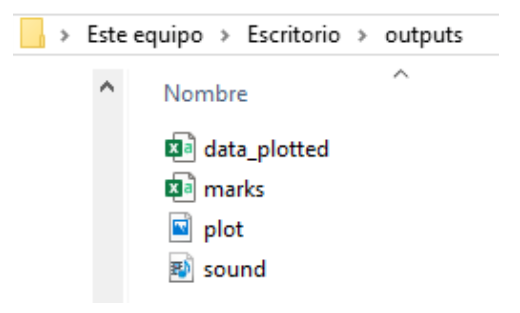
The stored files have defined extensions, the data and the coordinates are saved on csv format, the plot on png and the sound on wav. As an example, an image is shown with the four files on a folder named outputs (Image 22), the icon is assigned by the operative system and the name by the user.
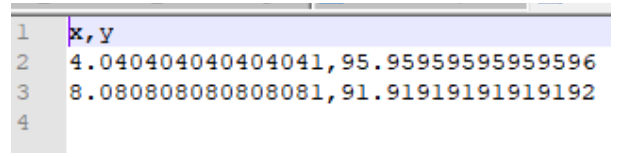
If the user opens the coordinate file with a text editor like notepad++ (Image 23), the program shows two columns separate by comma. The first row is the name of the coordinate, for the example is x and y, and the next rows are the coordinates.
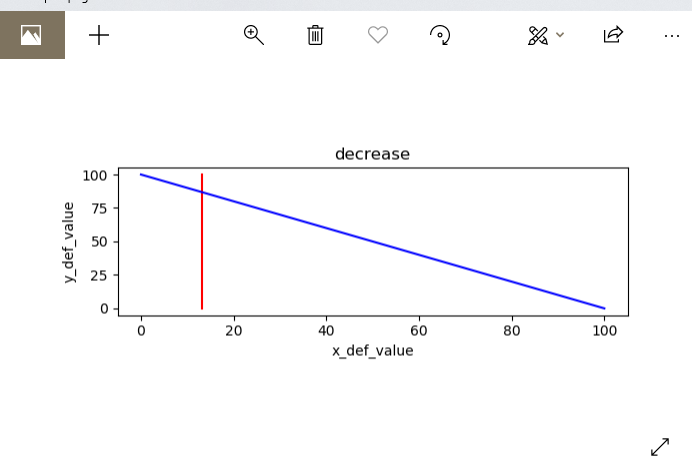
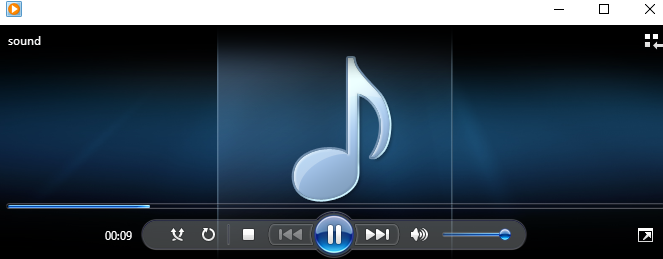
There is an image of the plot too (Image 24). The plot file is opened with the Windows photo viewer. In addition, the Image 25 shows the sound file on the Windows Media Player.