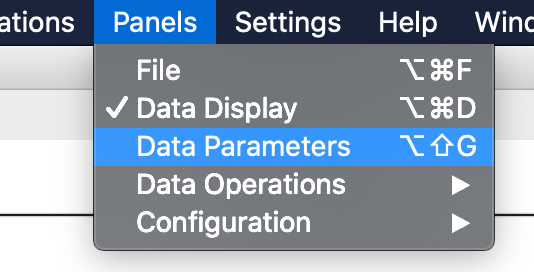
The ‘Data parameters’ item from the menu ‘Panel’ (Image 41) shows a new panel on the left of the plot, this new section contains some elements that display the data file in columns and allow the user to change the title of the data, change the columns titles and select which column plot as X axis and which as Y axis.
When import a file ‘decrease’ for example (this file is on the ‘sample_data’ folder), the data title text box shows the data file title, the data values are shown in the grid, and the first-row values of each column are shown in the axis list selection (Image 42).
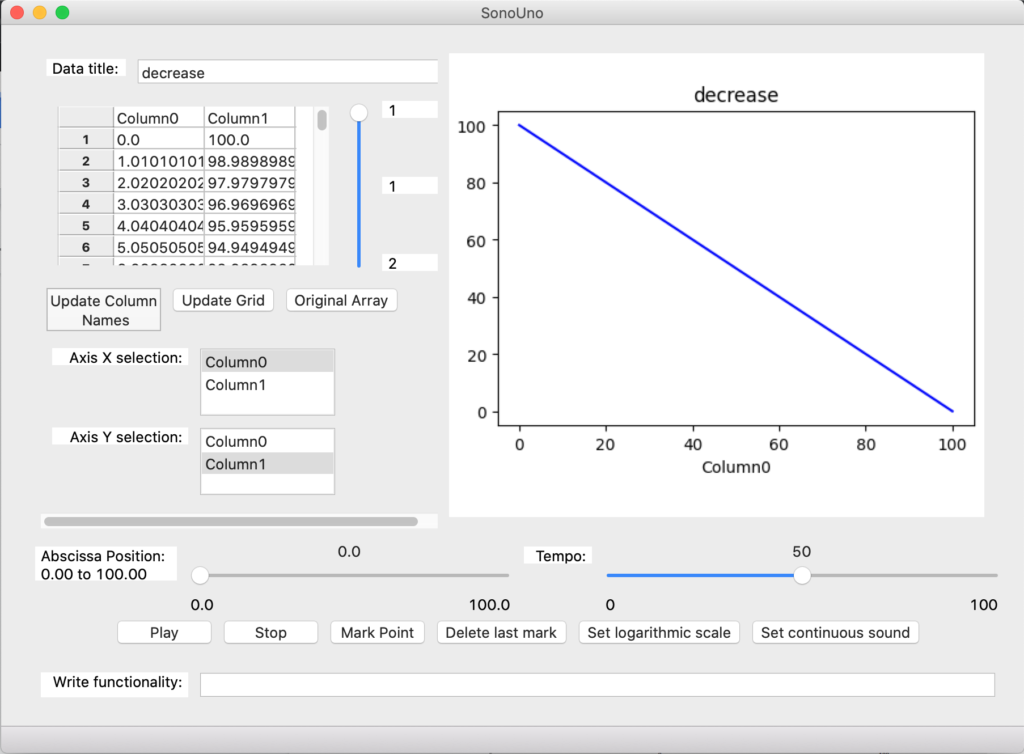
The first row of this file doesn’t contain the title of each column, the program put the generic name ‘Columnx’ on this case. On the grid the user can change the column names. Finally, to save the changes the user has to press the ‘Update column names’ button and the new columns titles have to be shown on the axis selections (Image 43).
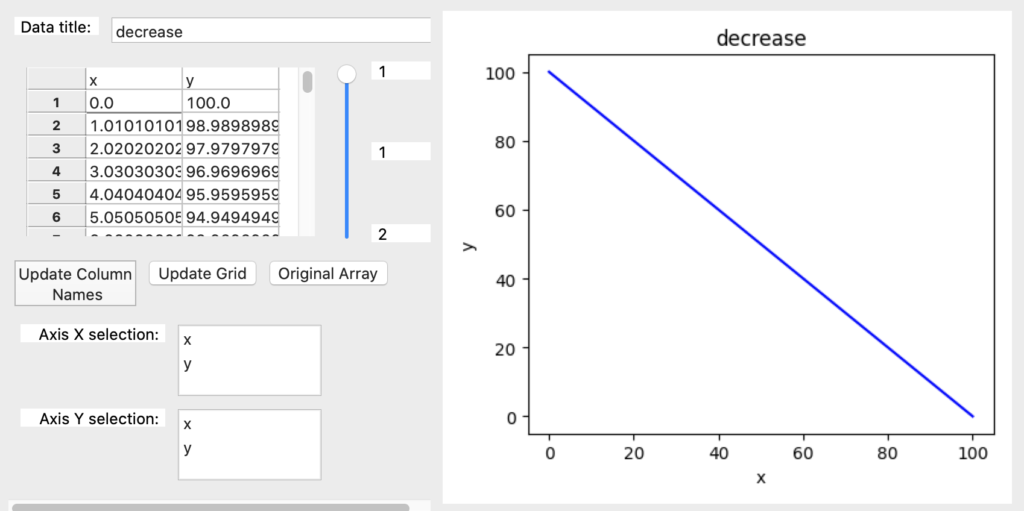
The ‘Update grid’ button shows the two columns plotted, just in case the user wants to display the data after some mathematical function. Finally, the ‘Original array’ button allows to show the original data again.
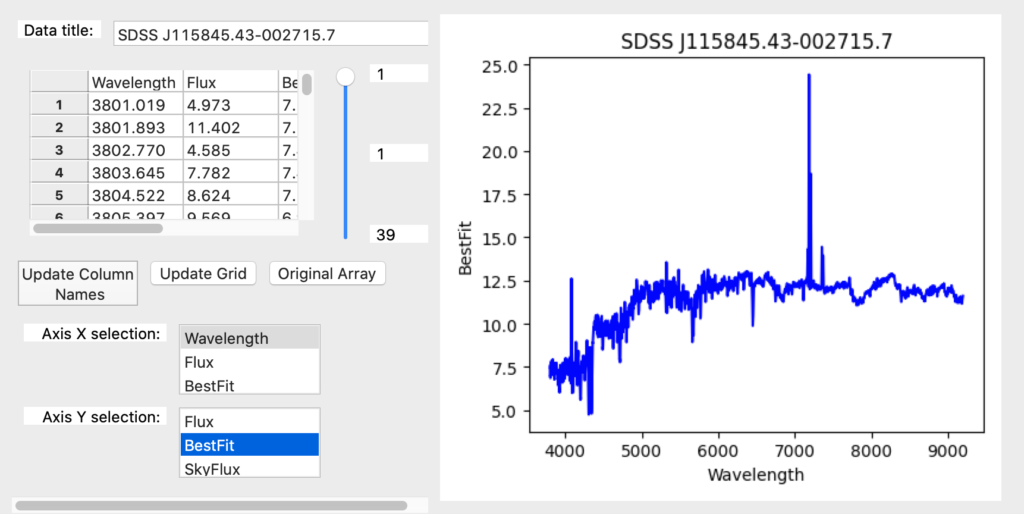
For the next example, a galaxy data file was download from the Sloan Digital Sky Survey database and opened with the software (Image 44).
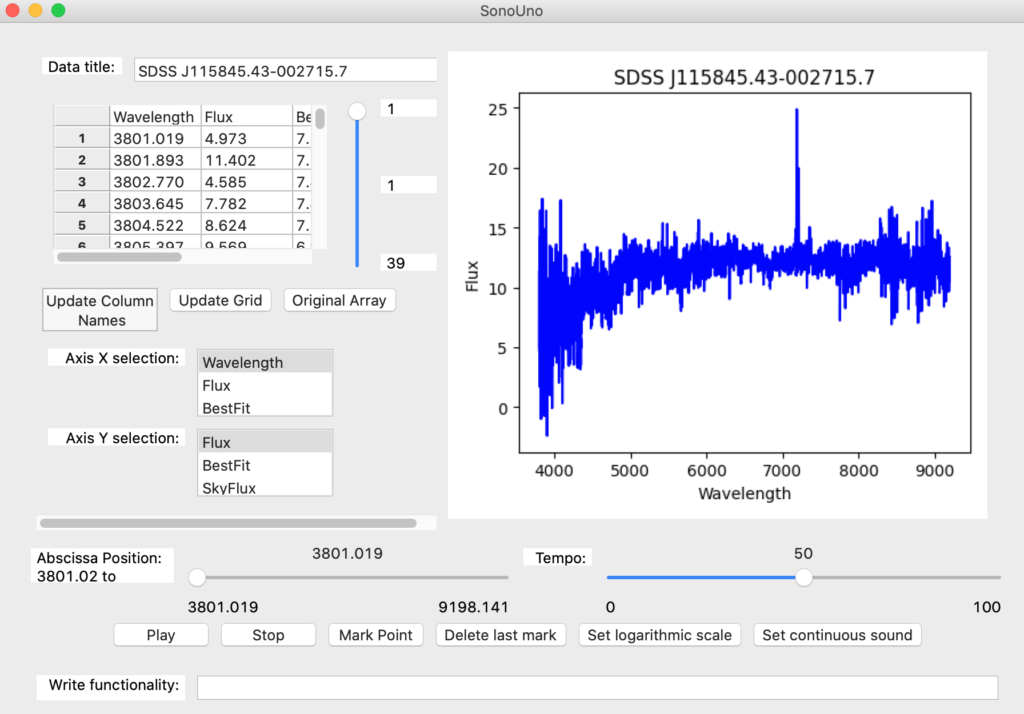
This new file has the column title on the first row, the user can modify the titles or change the column to plot, for example maintain Wavelength as X axis, and change to Best Fit on the Y axis (Image 45).
NOTE: The user has to keep in mind that these changes only have effects on the software, the file opened didn’t change and only the data plotted can be saved by the software.
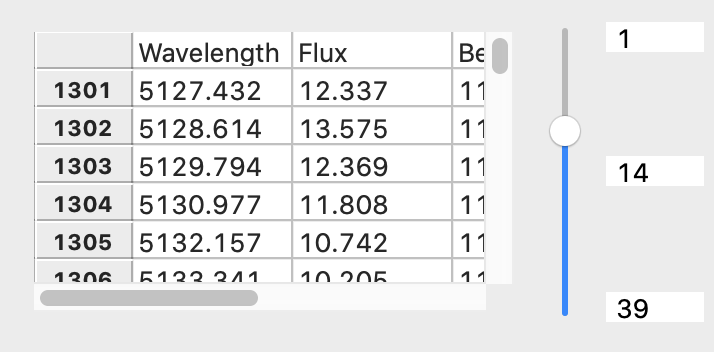
When the data file presents more than 100 rows, the software loads the data in pages of 100 values each one, and you can change between pages with the slider bar at the right of the grid (Image 46).
At the moment the sonoUno was tested with two column data with 1 million rows. This data was loaded without problems.