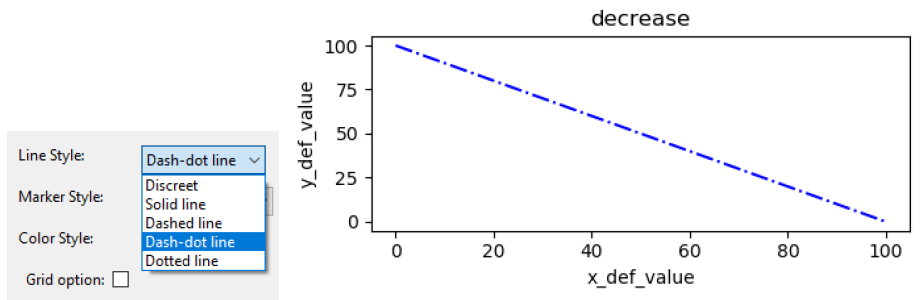
On the plot configuration panel, after the line style label, is placed the drop-down list with five options of style, which are: discreet, solid line, dashed line, dash-dot line and dotted line. In the example of the Image 75 the dash-dot line style is shown, with blue color and without markers.
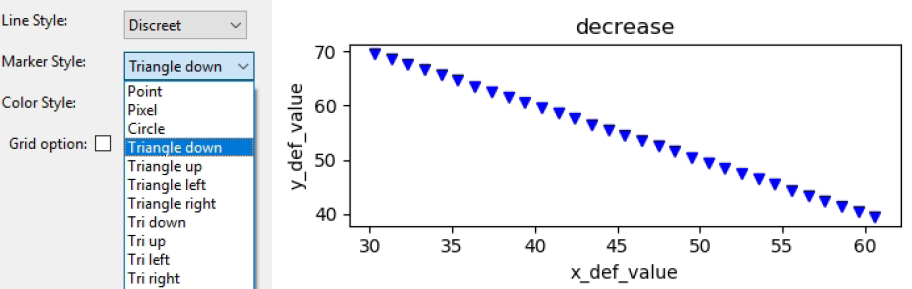
Analogously to the line style, after the marker style label, is found the drop-down list with different options of markers, some of them are: Point, Circle, Triangle down and Triangle up. In the Image 76 is used the triangle down marker, with the discreet line style and the color blue.
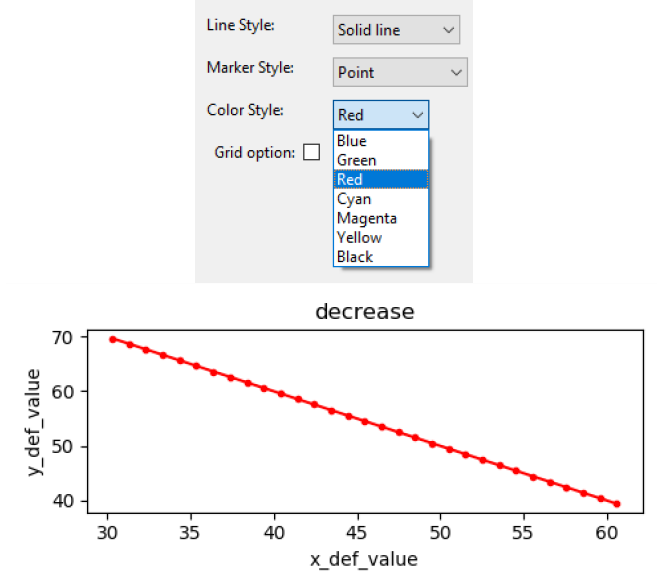
Next, after the color style label, is placed the drop-down list with seven colors: blue, green, red, cyan, magenta, yellow and black. In the example of the Image 77 is used the red color, with the solid line style and the point marker.