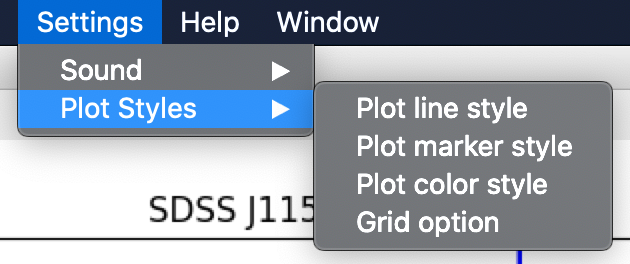
The plot configurations given are the plot style (line, marker and color) and grid option. To access the plot configurations panel, exist three ways, one is the plot style sub-menu from the setting menu, where are the items plot line style, plot marker style, plot color style and grid options (Image 72)
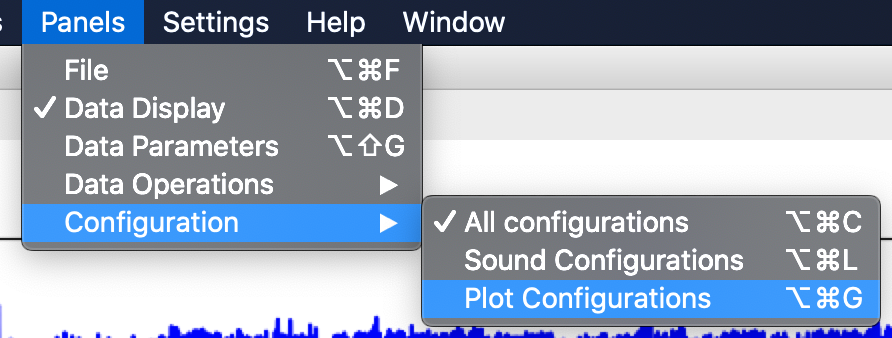
Another way is the plot configuration item on the configuration submenu from the menu Panels (Image 73)
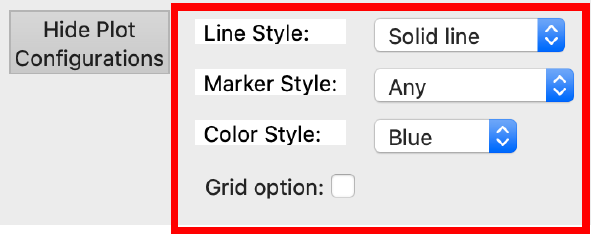
In addition, if the all configuration panel is enabled (section “4.4. Configuration options”) (Image 66), the user can utilize the show plot configuration button (Image 74), which when is pressed change the name to hide plot configurations and allow to hide the plot settings.